Measuring air quality
Get involved
Engagement
Raising Awareness
Alternatives

Scaling solutions to a global challenge
Our community lives with an invisible problem that potentially has wide-ranging impacts on both individuals and the economy as a whole: air pollution.
As citizens we have a legal right to clean air – but to be able to assert this right we must have access to information, as stipulated by the Aarhus Convention. Yet air quality was last measured in Sóller in 2007.
We believe that the right to access information about air quality is a precondition to the right to clean air: unless people know that there is an air quality problem, understand the risk it poses to their health and are informed about what measures are being taken to improve it, they are powerless to take action.
We can’t tackle what we can’t measure.
Because air pollution is hard to see, it’s often hard for us to pinpoint sources and trends to develop effective solutions. New sensor technology is changing that dynamic, allowing us to measure and map pollution concentrations street by street across the community and identify patterns and hotspots like never before.
Compared to conventional air pollution management, which commonly relies on a few sparsely located (and very expensive) monitors and modeling, hyperlocal monitoring allows for a more holistic picture of air quality at a high spatial resolution (with different concentrations every 100 meters, for example) and frequency (different concentrations every minute or few minutes, rather than on an hourly or daily basis).
Remember: different pollutants are present and travel in different ways, making a monitor in one spot often unable to detect a danger even 100 steps away. Research shows that air pollution is not evenly distributed and can in fact be up to eight times worse on one end of a street as another.
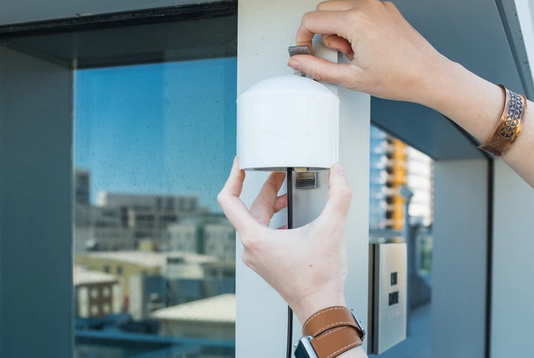
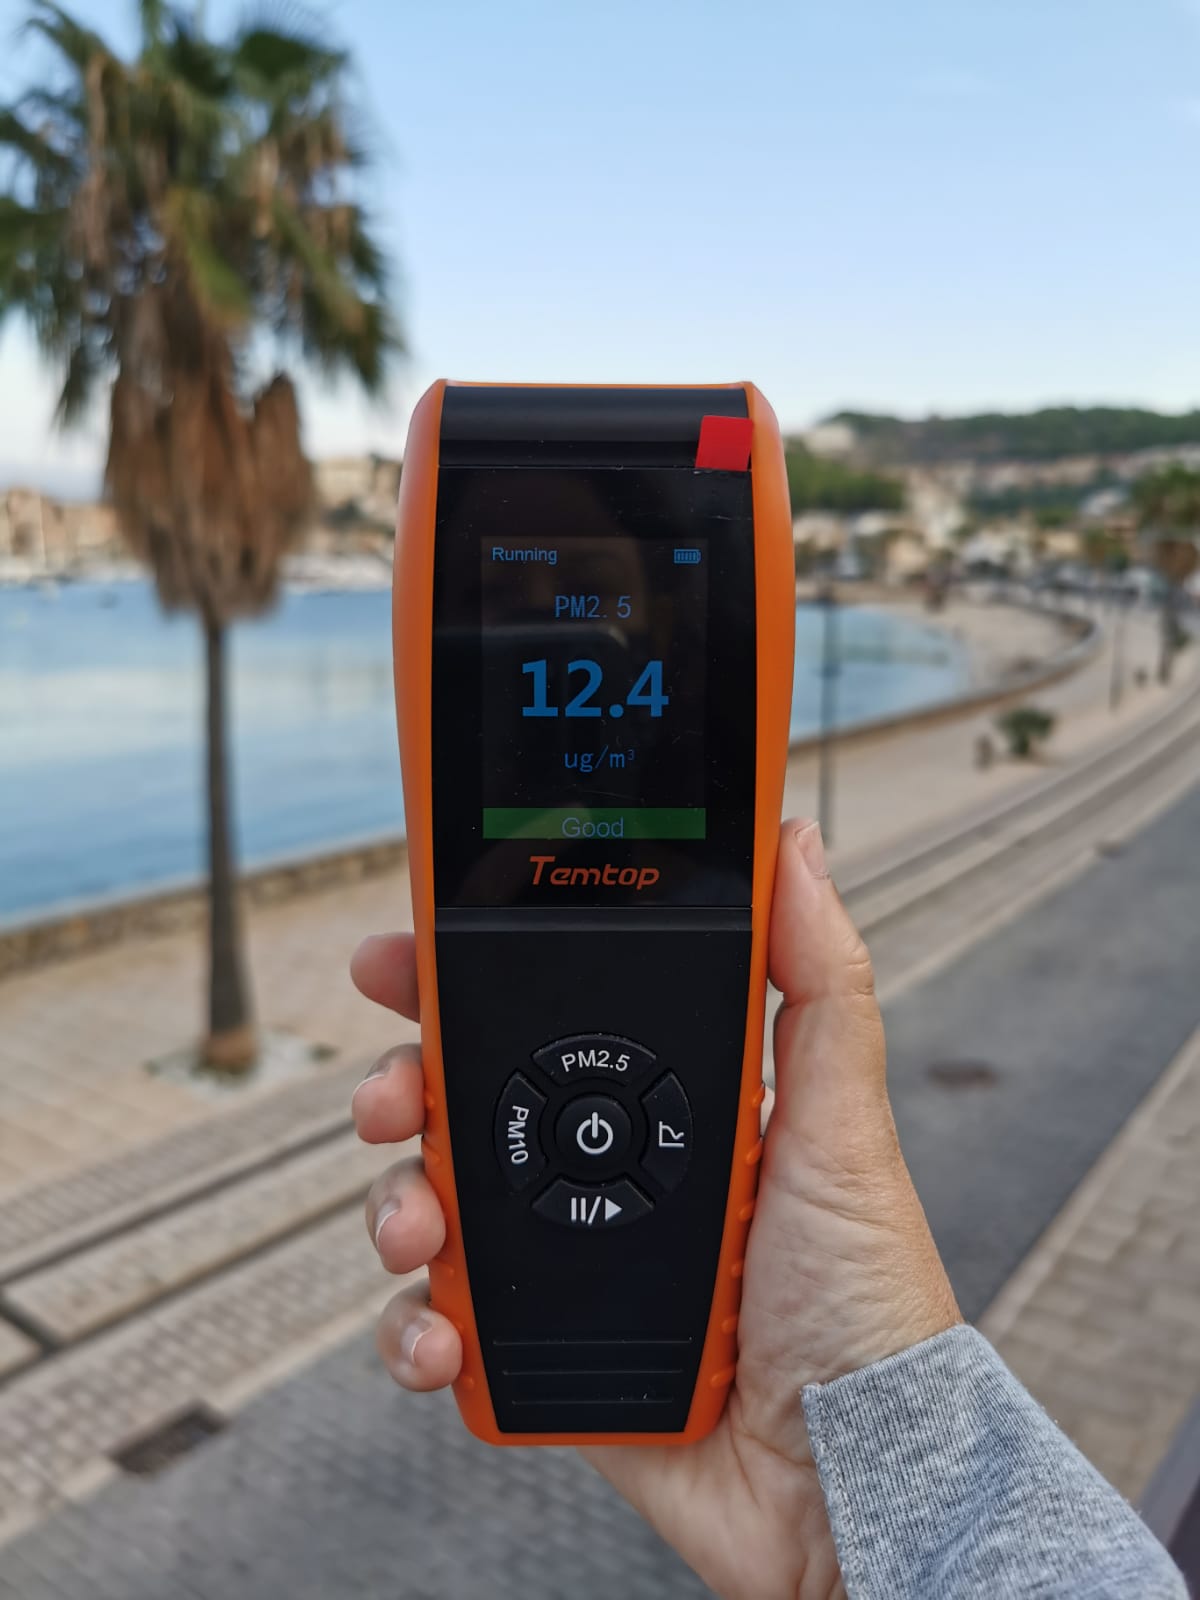
After an initial campaign deploying hand-held monitors, we are now committed to building a community air monitoring network. The goal of the community air monitoring network is to provide residents with accurate, real-time, local air quality data that may also be useful in scientific analysis. While these sensors are not approved by government regulatory agencies for use in regulatory actions, and their data cannot be used in legal cases, they can provide supplemental data that may be useful to communities, academic researchers, agencies, and others.
All information is available online, in real time, via our website map. In the future, we will also launch an app. Citizens will be able to sign up for alerts when levels of air pollution are high or when air quality is particularly low at a specific location, such as a school or sports stadium.
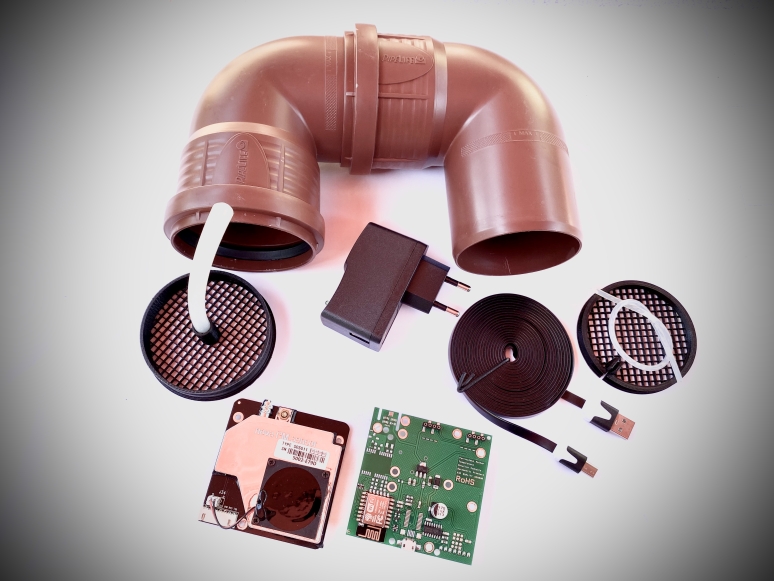
Using SDS011 particulate matter sensors, we form part of a wider network of 13,500 sensors worldwide in 73 countries. This is a successful citizen science initiative which was initially established by OK Lab Stuttgart, Germany. OK Lab Stuttgart is part of the Code for Germany program of the Open Knowledge Foundation Germany, an organisation that works to enable access to knowledge and encourage democratic participation by developing technologies and tools that strengthen civil society.

Monitoring Goals
Defining the pollutants of interest is a critical step in designing our network and choice of instruments. Air pollutants have different physical properties, as well as different health impacts, which have implications for how best to measure and map them. The pollutants we want to measure will be driven primarily by the emission sources of concern and the risk to human health.
In the case of the Sóller valley, we have chosen to measure particulate matter, PM 2.5 and PM 10.
Our immediate monitoring goals are:
- Identify air pollution problem and assess severity
- Create awareness
- Investigate source
Data Objectives
Our data objectives are focused on:
- Quantifying air pollution levels and characterizing pollution patterns across the valley
- Creating awareness
- Quantifying air pollution levels and characterizing pollution and associated health impact patterns across the valley
- Identifying the presence of pollutant(s) in excess of health benchmarks
- Identifying suspected emission sources (hotspots)


𝗙𝗘𝗕𝗥𝗘𝗥: 𝗟𝗮 𝗾𝘂𝗮𝗹𝗶𝘁𝗮𝘁 𝗱𝗲 𝗹'𝗮𝗶𝗿𝗲 𝗺𝗶𝗹𝗹𝗼𝗿𝗮
𝗘𝗹𝘀 𝗽𝗶𝘁𝗷𝗼𝗿𝘀 𝗻𝗶𝘃𝗲𝗹𝗹𝘀 𝗲𝘀 𝘃𝗮𝗻 𝗿𝗲𝗴𝗶𝘀𝘁𝗿𝗮𝗿 𝗽𝗿𝗼𝗽 𝗱𝗲𝗹 𝗖𝗮𝗺𝗽 𝗱𝗲 𝗙𝘂𝘁𝗯𝗼𝗹 𝗶 𝗮𝗹 𝗰𝗮𝗿𝗿𝗲𝗿 𝗜𝘀𝗮𝗯𝗲𝗹 𝗜𝗜.
Els alts nivells de contaminació durant els primers deu dies van ser seguits per nivells més baixos durant els dies de vent i pluja.
Els nivells de partícules PM 2,5 van caure al febrer en comparació amb els de gener i desembre. Tot i que el mes de febrer va començar amb alts nivells de contaminació atmosfèrica, l'inici del vent, amb vents que bufen des de l'oest, va conduir a nivells més baixos durant la segona meitat del mes. De fet, hi havia una forta correlació entre forts vents de l'oest i nivells més baixos de partícules.
No obstant això, va haver-hi dies en diversos sensors quan la xifra mitjana diària de PM 2.5 va superar les directrius de l'OMS.
Les directrius actuals estableixen que les concentracions mitjanes anuals de PM2,5 no haurien de superar els 5 μg/m³, mentre que les exposicions mitjanes de 24 hores no haurien de superar els 15 μg/m³ més de 3 - 4 dies a l'any.
Per exemple, el sensor d'Isabel II es va registrar dos d'aquests dies al febrer. Va registrar set dies d'aquest tipus al gener, cosa que significa que en només dos mesos ja ha tingut nou dies de nivells superiors a 15 μg/m³. El sensor prop de la plaça Estiradores es va registrar tres dies amb nivells superiors a 15. Només al febrer hi havia vuit dies amb nivells superiors a 15 prop del Camp de Futbol.
La qualitat de l'aire era millor a la carretera de Fornalutx, a prop de Biniaraix. Els pitjors nivells es van registrar prop del Camp de Futbol i al carrer Isabel II.
Els nivells mitjans de PM 2.5 per a tot el mes de febrer de 2024 van ser els següents:
Camp de Futbol: 11.04 μg/m³
Carrer Isabel II: 8.01 μg/m³
Estiradors: 7,25 μg/m³
Plaça de la Constitució: 7.05 μg/m³
Carrer Serra: 6,27 μg/m³
Gran Via: 5.21 μg/m³
Son Angelats: 5.15 μg/m³
Bar Molino: 4,89 μg/m³
Biniaraix/ Carretera de Fornalutx: 2,08 μg/m³
No obstant això, les mitjanes mensuals amaguen períodes de mala qualitat de l'aire.
Per exemple, al carrer Isabel II, el període de tres hores de 21:00 a 00:00 de l'1 de febrer de 2024 registrà un nivell mitjà d'aproximadament 42,34 μg/m³. I, tot i que el sensor prop de Bar Molino va mostrar una mitjana baixa per al mes en conjunt, de 09:00 a migdia el 8 de febrer de 2024, el nivell va ser de 46,18 μg/m³. A prop del Camp de Futbol, la mitjana de tres hores de 09:00 a migdia va ser d'aproximadament 88,72 μg/m³ el 14 de febrer. Al carrer Serra el sensor va registrar una mitjana de 67,34 μg/m³ el 8 de febrer de 09:00 a migdia. Prop d'Estiradors, la mitjana de tres hores de 12:00 a 15:00 del 7 de febrer va ser de 89,63 μg/m³.
El nivell més alt registrat de PM 2.5 va ser 546,0 μg/m³ el 14 de febrer de 2024, a les 09:12. A prop d'Estiradors es van registrar també xifres molt altes (533.0 μg/m³ el 7 de febrer de 2024, a les 13:30).
Ls cifres més alts es van registrar generalment als matins, gairebé sempre entre les 09:00 i les 10:00. No obstant això, a les nits hi va haver períodes més llargs de contaminació atmosfèrica sostinguda. Les gràfiques que mostren mitjanes horàries de PM 2.5 per al mes de febrer tenen una forma característica "w". Els nivells més baixos durant la nit van seguits d'una pujada de nivell a partir de les 7:00, amb un pic entre les 09:00 i les 10:00. Els nivells cauen i són baixos de 12:00 a 16:00. Després s'aixequen de nou, arribant a un nou pic al voltant de les 21:00 o les 22:00.
No obstant això, alguns sensors mostren taxes nocturnes més altes que altres. Aquests es troben generalment al centre urbà i, per tant, estan exposats a concentracions més altes de de partícules PM 2,5 procedents de la calefacció domèstica, principalment estufes de llenya.
Finalment, vam trobar una forta correlació entre la velocitat del vent i els nivells més baixos de PM 2.5. Els nivells de PM 2.5 també eren més baixos quan els vents bufaven des de l'oest.
Vegeu l'entrada anterior:
Els gràfics mostren els nivells de PM 2,5 diàries ... See MoreSee Less
0 CommentsComment on Facebook
𝗟𝗮 𝗾𝘂𝗮𝗹𝗶𝘁𝗮𝘁 𝗱𝗲 𝗹'𝗮𝗶𝗿𝗲 𝗺𝗶𝗹𝗹𝗼𝗿𝗮 𝗮𝗹 𝗳𝗲𝗯𝗿𝗲𝗿.
𝗘𝗹𝘀 𝗮𝗹𝘁𝘀 𝗻𝗶𝘃𝗲𝗹𝗹𝘀 𝗱𝗲 𝗰𝗼𝗻𝘁𝗮𝗺𝗶𝗻𝗮𝗰𝗶𝗼́ 𝗱𝘂𝗿𝗮𝗻𝘁 𝗲𝗹𝘀 𝗽𝗿𝗶𝗺𝗲𝗿𝘀 𝗱𝗲𝘂 𝗱𝗶𝗲𝘀 𝘃𝗮𝗻 𝘀𝗲𝗿 𝘀𝗲𝗴𝘂𝗶𝘁𝘀 𝗽𝗲𝗿 𝗻𝗶𝘃𝗲𝗹𝗹𝘀 𝗺𝗲́𝘀 𝗯𝗮𝗶𝘅𝗼𝘀 𝗱𝘂𝗿𝗮𝗻𝘁 𝗲𝗹𝘀 𝗱𝗶𝗲𝘀 𝘃𝗲𝗻𝘁𝗼𝘀𝗼𝘀 𝗱𝘂𝗿𝗮𝗻𝘁 𝗹𝗲𝘀 𝗱𝘂𝗲𝘀 𝘀𝗲𝘁𝗺𝗮𝗻𝗲𝘀 𝘀𝗲𝗴𝘂̈𝗲𝗻𝘁𝘀.
Davant els nivells globals de contaminació atmosfèrica de febrer que publicarem demà o dimarts, ara és un bon moment per explorar si els fenòmens meteorològics poden ser bons predictors de nivells més alts o més baixos de partícules PM 2.5 a l'aire de la vall de Sóller.
Després del temps relativament monòton de gener, el febrer ens va oferir un temps molt interessant. Hi havia disset dies sense gota de pluja. Però després n'hi havia d'altres amb pluges molt fortes (principalment els tres últims dies del mes). Hi va haver dies tranquils i sense vent i dies de ràfegues dramàtiques; i els vents, quan van venir, ens van venir de totes direccions. Pel que fa a les temperatures, hi havia nits fredes (de 6 a 7 graus) però també tardes càlides (fins a 22,4 a mitjan mes).
Comparem totes les dades meteorològiques contra les dades de partícules. He triat les dades d'Isabel II al centre de Sóller.
𝗩𝗲𝗴𝗲𝘂 𝗲𝗹𝘀 𝗴𝗿𝗮̀𝗳𝗶𝗰𝘀 𝗽𝗲𝗿 𝗮 𝗰𝗼𝗺𝗽𝗮𝗿𝗮𝗿 𝗲𝗻𝘁𝗿𝗲 𝗹𝗮 𝗺𝗶𝘁𝗷𝗮𝗻𝗮 𝗱𝗶𝗮̀𝗿𝗶𝗮 𝗱𝗲 𝗣𝗠𝟮.𝟱 𝗶:
𝗧𝗲𝗺𝗽𝗲𝗿𝗮𝘁𝘂𝗿𝗮 𝗺𝗶𝘁𝗷𝗮𝗻𝗮 𝗱𝗶𝗮̀𝗿𝗶𝗮.
𝗧𝗲𝗺𝗽𝗲𝗿𝗮𝘁𝘂𝗿𝗮 𝗱𝗶𝗮̀𝗿𝗶𝗮 𝗺𝗲́𝘀 𝗯𝗮𝗶𝘅𝗮.
𝗧𝗲𝗺𝗽𝗲𝗿𝗮𝘁𝘂𝗿𝗮 𝗱𝗶𝗮̀𝗿𝗶𝗮 𝗺𝗲́𝘀 𝗮𝗹𝘁𝗮.
𝗣𝗹𝘂𝘃𝗶𝗼𝗺𝗲𝘁𝗿𝗶𝗮 𝗱𝗶𝗮̀𝗿𝗶𝗮 𝘁𝗼𝘁𝗮𝗹 𝗲𝗻 𝗺𝗺.
𝗩𝗲𝗹𝗼𝗰𝗶𝘁𝗮𝘁 𝗺𝗶𝘁𝗷𝗮𝗻𝗮 𝗱𝗶𝗮̀𝗿𝗶𝗮 𝗱𝗲𝗹 𝘃𝗲𝗻𝘁.
Per determinar la correlació més gran o la correlació negativa entre els nivells de PM 2.5 i els diversos factors meteorològics (temperatura, velocitat del vent i precipitacions), podem calcular el coeficient de correlació de Pearson per a cada parell. El coeficient de correlació de Pearson oscil·la entre -1 i 1, on:
1 indica una relació lineal positiva perfecta,
-1 indica una relació lineal negativa perfecta, i
0 indica que no hi ha relació lineal.
Calculem aquests coeficients de correlació per PM 2.5 amb:
Temperatura diària més baixa,
Temperatura diària més alta,
Velocitat mitjana diària del vent, i
Pluja diària.
Això ajudarà a identificar quin factor meteorològic és el millor predictor per als nivells de PM 2.5.
𝗕𝗮𝘀𝗮𝘁 𝗲𝗻 𝗲𝗹𝘀 𝗰𝗼𝗲𝗳𝗶𝗰𝗶𝗲𝗻𝘁𝘀 𝗱𝗲 𝗰𝗼𝗿𝗿𝗲𝗹𝗮𝗰𝗶𝗼́ 𝗱𝗲 𝗣𝗲𝗮𝗿𝘀𝗼𝗻 𝗰𝗮𝗹𝗰𝘂𝗹𝗮𝘁𝘀:
𝗣𝗠 𝟮.𝟱 𝘃𝘀. 𝗧𝗲𝗺𝗽𝗲𝗿𝗮𝘁𝘂𝗿𝗮 𝗱𝗶𝗮̀𝗿𝗶𝗮 𝗺𝗲́𝘀 𝗯𝗮𝗶𝘅𝗮: -𝟬,𝟰𝟲
𝗣𝗠 𝟮.𝟱 𝘃𝘀. 𝗧𝗲𝗺𝗽𝗲𝗿𝗮𝘁𝘂𝗿𝗮 𝗱𝗶𝗮̀𝗿𝗶𝗮 𝗺𝗲́𝘀 𝗮𝗹𝘁𝗮: 𝟬.𝟮𝟬
𝗣𝗠 𝟮.𝟱 𝘃𝘀. 𝗩𝗲𝗹𝗼𝗰𝗶𝘁𝗮𝘁 𝗺𝗶𝘁𝗷𝗮𝗻𝗮 𝗱𝗲𝗹 𝘃𝗲𝗻𝘁 (𝗸𝗺/𝗵): -𝟬,𝟳𝟮
𝗣𝗠 𝟮.𝟱 𝘃𝘀. 𝗣𝗹𝘂𝗷𝗮 (𝗺𝗺): -𝟬,𝟮𝟯
La correlació més gran s'observa entre els nivells de PM 2.5 i la velocitat mitjana diària del vent, amb un coeficient de -0,72, que indica una forta relació lineal negativa. Això suggereix que a mesura que augmenta la velocitat del vent, els nivells de PM 2,5 tendeixen a disminuir. Per tant, la velocitat del vent sembla ser el millor predictor – el febrer de 2024 – per als nivells de PM 2.5 entre els factors que analitzem.
𝗟𝗹𝗲𝗯𝗲𝗶𝗴, 𝗽𝗼𝗻𝗲𝗻𝘁 𝗶 𝗺𝗲𝘀𝘁𝗿𝗮𝗹
També vaig pensar que seria interessant comprovar si la direcció dels vents influeix en els nivells de partícules. Sorprenentment, hi va haver una correlació significativa entre els vents de l’oest (llebeig, ponent i, sobretot, mestral) i els baixos nivells de contaminació. Molts dels vents més alts del mes eren de l’oest, però de cap manera tots.
Un enfocament comú per analitzar la relació entre una variable categòrica (com la direcció del vent) i una variable contínua (com els nivells de PM 2.5) és utilitzar ANOVA (Anàlisi de la Variància) o visualitzar les dades per veure si hi ha una tendència aparent.
Classifiquem la direcció del vent en funció de si és predominantment de l'oest o no, i després visualitzem els nivells mitjans de PM 2.5. Aquest enfocament simplifica l'anàlisi i podria revelar si la direcció del vent (en concret, els vents de l'oest) té alguna influència general en els nivells de PM 2.5.
𝗩𝗲𝗴𝗲𝘂 𝗚𝗿𝗮̀𝗳𝗶𝗰 𝗱𝗲 𝗯𝗮𝗿𝗿𝗲𝘀 𝟲.
El gràfic de barres 6 mostra la mitjana de nivells de PM 2.5 per a dues categories de direcció del vent: 'Westerly' (vents de l'oest) i 'Other' (totes les altres direccions del vent). Aquesta visualització ens ajuda a observar si hi ha una diferència notable en els nivells de PM 2.5 en funció de la direcció general del vent, específicament respecte als vents de l'oest en comparació amb altres direccions.
El nivell mitjà de PM 2.5 per a la categoria de direcció de vent "Westerly" era aproximadament de 3,92, i per a la categoria "Other", era aproximadament de 9,26. La diferència percentual entre aquestes dues categories és aproximadament -57,68%, indicant que els nivells mitjans de PM 2,5 quan la direcció del vent és de l’oest són significativament més baixos que quan el vent ve d'altres direccions.
És necessària una anàlisi més detallada. Van arribar els vents de l’oest quan van acabar els episodis anticiclònics? Sabem que hi ha una forta correlació entre els sistemes anticiclònics a l'hivern i els episodis d'inversió tèrmica i els dies clars i sense vent.
𝗗𝗲 𝗺𝗼𝗺𝗲𝗻𝘁, 𝗽𝗼𝗱𝗲𝗺 𝗱𝗶𝗿 𝗲𝗹 𝘀𝗲𝗴𝘂̈𝗲𝗻𝘁:
𝗠𝗶𝗹𝗹𝗼𝗿 𝗽𝗿𝗲𝗱𝗶𝗰𝘁𝗼𝗿 𝗽𝗲𝗿 𝗮 𝗻𝗶𝘃𝗲𝗹𝗹𝘀 𝗺𝗲́𝘀 𝗮𝗹𝘁𝘀 𝗱𝗲 𝗣𝗠 𝟮.𝟱
Velocitat del vent baixa: La correlació negativa més forta es va observar entre els nivells de PM 2.5 i la velocitat mitjana diària del vent (-0,72), indicant que les velocitats del vent més baixes s'associen amb nivells més alts de PM 2.5. Això és coherent amb l'enteniment que les baixes velocitats del vent donen lloc a una menor dispersió de les partícules aerotransportades, el que condueix a concentracions més altes de PM 2.5.
Manca de vents de l'oest: L'anàlisi comparativa dels nivells mitjans de PM 2.5 per la categoria de direcció del vent va mostrar nivells significativament més baixos de PM 2.5 per als vents de l'oest en comparació amb altres direccions. Això suggereix que els períodes sense vents predominants a l'oest podrien associar-se amb nivells més alts de PM 2,5, possiblement a causa de la geografia local específica i els patrons de vent predominants que influeixen en la qualitat de l'aire.
𝗠𝗶𝗹𝗹𝗼𝗿 𝗣𝗿𝗲𝗱𝗶𝗰𝘁𝗼𝗿 𝗽𝗲𝗿 𝗮𝗹𝘀 𝗻𝗶𝘃𝗲𝗹𝗹𝘀 𝗺𝗲́𝘀 𝗯𝗮𝗶𝘅𝗼𝘀 𝗱𝗲 𝗣𝗠 𝟮.𝟱
Alta Velocitat del vent: Al revés, les altes velocitats del vent serien el millor predictor per als nivells més baixos de PM 2.5, ja que faciliten la dispersió de contaminants de l'aire, reduint les concentracions de PM 2.5.
Vents de l'oest: La presència de vents de l'oest es va associar amb nivells significativament més baixos de PM 2,5, fent-lo un predictor potencial per a una millor qualitat de l'aire. Això podria ser a causa de la massa d'aire més neta procedent de l'oest o la dispersió efectiva de contaminants per aquests patrons de vent.
𝗔𝗹𝘁𝗿𝗲𝘀 𝗳𝗮𝗰𝘁𝗼𝗿𝘀:
Temperatura: La correlació entre la temperatura (tant la més baixa com la més alta temperatura diària) i els nivells de PM 2.5 era més feble en comparació amb la velocitat del vent.
Pluja: Les pluges tenien una correlació relativament baixa amb els nivells de PM 2.5 (-0,23), indicant una relació directa més feble. Tot i això, la precipitació pot ajudar a reduir la matèria particulada transmesa per l'aire "rentant" contaminants de l'aire. En el cas de Sóller, pot significar menys cremas a l'aire lliure. No obstant això, l'ús interior d’estufes de llenya per a la calefacció domèstica probablement no es veuria afectat.
𝗖𝗼𝗻𝗰𝗹𝘂𝘀𝗶𝗼́:
Per predir els nivells més alts de PM 2.5, les baixes velocitats del vent i els períodes sense vents predominants de l'oest serien indicadors clau, mentre que les altes velocitats del vent i la presència de vents de l'oest serien més indicatius de nivells més baixos de PM 2.5. ... See MoreSee Less
1 CommentComment on Facebook
Hi Barry.. great data. Be careful tho as Anova..(Analysis of variance) should only be used once the data has been screened to see if it complies with the rules for a 'normal' distribution (bell shaped with a mean and equidistant confidence intervals). If it does not comply then a Ki squared or other comparative test for non normal or squed data should be used.👍🙏
Air pollution: EU Parliament and Council strike deal to improve air quality.
New rules will slash the yearly limits for PM2.5 from 25 µg/m³ to 10 µg/m³.
On Tuesday, negotiators from the European Parliament and Council reached a provisional political agreement on new measures to ensure air quality in the EU is not harmful to human health, natural ecosystems and biodiversity with the aim to eliminate air pollution by 2050.
The new rules slash the yearly limits for fine particulates known as PM2.5 – which wreak havoc on the whole body because they are small enough to slip into the bloodstream – from 25 µg/m³ to 10 µg/m³.
But the targets still allow twice as much pollution as the guideline levels set by the World Health Organization (5 µg/m³).
The law also gives citizens the right to compensation when governments fail to follow the measures and damage their health as a result.
All member states will have to create air quality roadmaps by 31 December 2028 that set out short- and long-term measures to comply with the new 2030 limit values as proposed by Parliament.
An EU-commissioned report worked out the net benefit to society each year to be €90bn (£77bn) if PM2.5 levels were limited to 15 µg/m3, and €123bn if they were brought down to 5 µg/m3.
The deal still has to be adopted by Parliament and the Council, after which the new law will be published in the EU Official Journal and enter into force 20 days later. EU countries will then have two years to apply the new rules. ... See MoreSee Less
1 CommentComment on Facebook
Sound on… this will be the new norm (and best in mind this is from one small property, 150m away from my microphone)…
Contaminació atmosfèrica: el Parlament i el Consell de la UE arriben a un acord per a millorar la qualitat de l'aire.
Les noves normes reduiran els límits anuals de PM2,5 de 25 µg/m³ a 10 µg/m³.
El dimarts, els negociadors del Parlament Europeu i del Consell van aconseguir un acord polític provisional sobre noves mesures per a garantir que la qualitat de l'aire a la UE no sigui perjudicial per a la salut humana, els ecosistemes naturals i la biodiversitat, amb l'objectiu d'eliminar la contaminació de l'aire per a 2050.
Les noves normes redueixen els límits anuals per a les partícules fines PM2,5 (que causen estralls en tot el cos perquè són prou petites per a passar al sistema sanguini) de 25 µg/m³ a 10 µg/m³.
Però els objectius encara permeten nivells que dupliquen els nivells orientatius establerts per l'Organització Mundial de la Salut (5 µg/m³).
La llei també atorga als ciutadans el dret a una compensació quan els governs no compleixen amb les mesures i, com a resultat, danyen la seva salut.
Tots els estats membres hauran de crear fulls de ruta sobre la qualitat de l'aire abans del 31 de desembre de 2028 amb mesures a curt i llarg termini i per a complir amb els nous valors límit per a 2030.
Un informe encarregat per la UE va calcular que el benefici net per a la societat cada any seria de 90.000 milions d'euros si els nivells de PM2,5 es limitessin a 15 µg/m³, i de 123.000 milions d'euros si es reduïssin a 5 µg/m³.
L'acord encara ha de ser adoptat pel Parlament i el Consell, després de la qual cosa la nova llei es publicarà i entrarà en vigor vint dies després. Els països de la UE tindran llavors dos anys per a aplicar les noves normes. ... See MoreSee Less
0 CommentsComment on Facebook
Hi ha nivells molt alts de contaminants PM 2,5 aquest matí en la zona més cèntrica del municipi, sobretot en la Plaça i Isabel II, on registrem nivells de 125 a 145.
sollerperlaire.org/ca/mapa/ ... See MoreSee Less
0 CommentsComment on Facebook